Better tracking. Period.
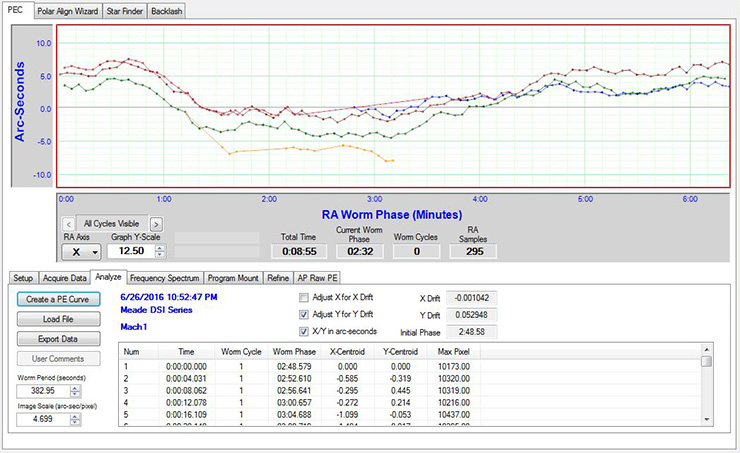
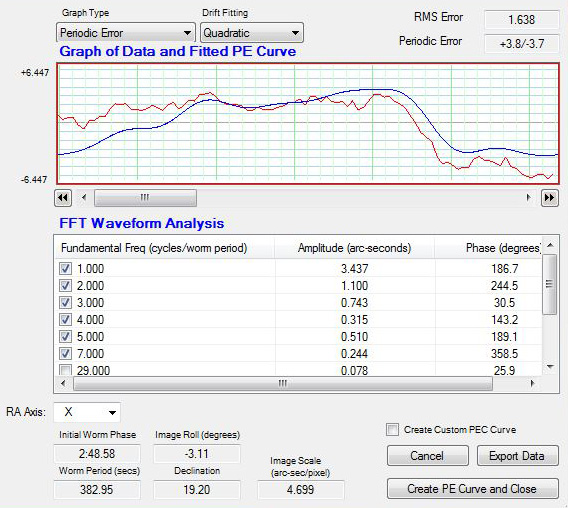
6/24/2016. Clear all day. Clear through twilight. Clear while I calibrated PemPro for another go at rebuilding the Periodic Error Compensation curve for the A-P mount. And cloudy three minutes after I said, "Take data." But the sky came and went. In one clearish interlude, I got most of three and a quarter worm cycles (ignore the "worm cycles" counted in the graphic below). The mount appears to be very slightly out of spec (+4/-4 arc seconds with linear curve-fitting, exactly at the limit of specs with quadratic fitting) but the error is very smooth and repeatable. FFT analysis shows that most of the periodic error is down to the worm cycle with about 20-25% owing to the first reduction gear. This is a big improvement over the wierd and erratic error I was seeing before remeshing.
The error I see now would guide out easily, and it's the kind of error I expect PEC to hammer down effectively. I built a curve and loaded it tonight, but I would feel better with one built from five or six turns of the worm under consistently clear skies. And, obviously, I'd like to see some before and after datasets. FWIW: I made a point of calibrating the mount and camera in the same part of the sky where I took data. I used 2 second intervals and 1.8 second exposures, and I chose a star with a flux level of about 10k. We're getting there. It's worth noting that the numbers here rely very heavily on calculated centroids: one pixel corresponds to 4.7 seconds of arc.


6/28/2016. I got started in the twilight, with an appropriately bright star near Arcturus. First, I took one cycle of data to be sure the error profile resembled what I saw last time out. It did. It was shaped similarly and ranged 4 or 5 seconds of arc to either side of perfect. I activated PEC and saw the error dramatically increase. So I downloaded the curve from the mount to confirm that it was the curve I'd previously generated and uploaded (it was), inverted it, and reloaded it. Victory! The error shown by the next turn of the worm was about a fourth as large as before: +1.3/-1.2 seconds of arc.
Why stop there? Now that I knew things worked, I disabled the merely promising curve and took several worm cycles of fresh data. Here's a snapshot of the screen on the remote computer after reading 8 worm-cycles of tracking data:

5th order fit: +4.2/-4.7 arcseconds peak to peak (1.318 RMS)
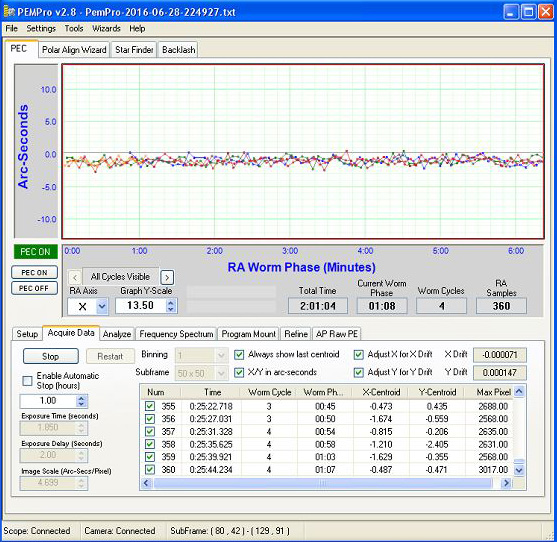
You see how cyclic the error is --the same curve drawn over and over as the worm turns. I had PemPro generate a PEC curve (5th order, all harmonics) from these data, invert it, and upload it to the mount. And for my trouble, here are four cycles of data collected using this new periodic error correction curve:

5th order fit: +0.4/-0.5 (0.511 RMS)
The remaining periodic error is 0.9 arcseconds peak to peak, and that is the worst case I could find in any available analysis mode (5th order, all harmonics included). Most analyses (linear, quadratic, etc) show peak to peak errors of less than half that. There are no significant peaks in the FFT analysis, so I infer that what I am seeing is essentially zero residual periodic error and noise that can be put down to seeing. Now can I please make some photos?